Technology Stack


The Client
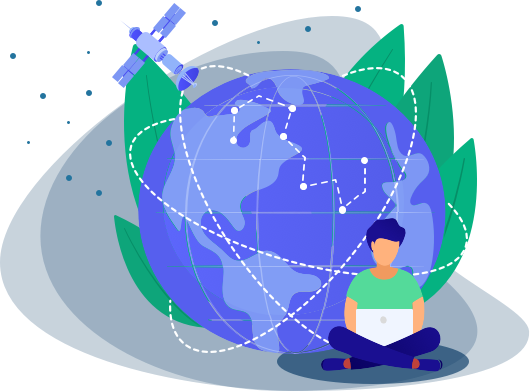
This is a risk analysis platform that derives Earth Observation (EO) data from satellite imagery to disclose potential environmental and social risks. Investors can leverage this location data to spot high-risk areas and make informed investment decisions while minimizing ecological impacts.

The Challenge
Our primary goal was to enhance this risk intelligence platform with added insights into climate scenarios for risk-free investments.
However, what was challenging was to accumulate and structure massive EO datasets for easy navigation and viewing. Moreover, we had to include a data tree hierarchy coupled with gridded and imagery information for quick assessment of environmental conditions. Also, we had to develop a workable solution or an algorithm for storing, retrieving, and querying large amounts of heterogeneous data.
In short, we aimed to step up geospatial visualization to forecast catastrophic events and de-risk future investments.

The Solution
Capital Numbers’ team went ahead with this project by adding custom features that can empower investors with decision-ready risk analysis. Our project managers and developers started working in parallel to upgrade the platform and ensure quick delivery with continuous innovation.
The tech stack we used included the following:
We selected Python for designing the web interface. We chose Python because it comes with a clean object-oriented design, enhanced process control capabilities, and a unit-testing framework that improves app speed and productivity. Plus, its extensive support libraries and third-party modules help create well-structured websites.
We picked Flask for the frontend because of its modularity. Besides, it comes with nicely-documented APIs and is WSGI (Web Server Gateway Interface) compliant, which promises excellent interoperability and flexibility.
To add interactive visualizations, we used Plotly’s Dash framework. It helped us create scatter plots, line charts, bar graphs, and hover-overs with ease. Moreover, Dash allowed us to add out-of-the-box components like multi-select drop-downs, radio buttons, and checkboxes smoothly.
To offer a flexible map experience, we used Dash Leaflet. It helped us include beautiful maps containing hundreds of georeferences.
To enable high-performance data processing, our experts used the NumPy (Numerical Python) package. It merged heterogeneous datasets in a streamlined way. Besides, we leveraged Pandas for data gathering and data munging.
Results
By combining the above stack with location intelligence, Capital Numbers successfully offered a powerful solution that offers deep visibility into EO data (e.g., geographically-distributed assets, companies, portfolios, and water bodies).
Our engineers used AI best practices to process raw information and predict risks/stabilities at various spots worldwide.
Our critical contributions included:
All-in-one Risk and Threat Intelligence Platform
We skillfully deployed an all-inclusive geospatial risk intelligence solution for investors/traders/builders to accurately evaluate venture opportunities.
Satellite EO Capabilities for Risk Reduction
We used Machine Learning algorithms to convert scattered EO data into valuable knowledge to help with situation awareness and sustainable development.
Data Tree
We incorporated a data tree in the website to add a logical flow to the site map. This helped us:
- Categorize multiple pages and documents
- Nest sub-pages inside parent pages
- Identify top-level groupings
- Provide information with clean drop-down lists
- Display document path through each document URL
- Compress vast data into a small space
Dynamic Components
We added dynamic components (e.g., asset maps, lake maps, etc.) to help companies measure development suitabilities/risks in and around water bodies.
GIS Map Module and Comparisons
Our team used advanced map modules to statistically compare spatial similarities/dissimilarities across two or more regions for informed decision-making.
Draggable Charts
We included draggable charts/bars/maps to flex and rearrange items in any order or direction for optimized visualizations.
Toggle Views
Our experts even added toggle views to turn dynamically created elements into static, thereby not letting one card overlap the other.
Super-fast Clustering
We leveraged the Supercluster library to aggregate a vast array of data points at a lightning-fast speed at each zoom level on maps.
Unparalleled Navigation
Systematic clustering helped us beautifully display thousands of markers on a web map and allowed us to offer unparalleled navigation.
Data Visualizations
All in all, we could effectively turn vast EO data into interactive visuals for users to zoom in, zoom out, hover over, drag, and interact with displayed information as per their choice.
Minimum Viable Product (MVP)
We successfully rolled out this MVP with the core features to offer immediate value to the early adopters.
Elevated Insights for Risk-free Investments
The resulting product is a visual canvas of high-resolution earth data and maps with effective drill-downs that unfold information layer-by-layer and promise flawless UX.
Capital Numbers’ solution can now help companies gain a better sense of where their investments are vulnerable to risks, thereby paving the way for a sustainable future.
Great Reviews
97 Out Of 100 Clients Have Given Us A Five Star Rating On Google & Clutch

George Levy
Chief Learning Officer, Blockchain Institute of Technology
"I am glad I found Capital Numbers and I credit them for a lot of the success I have had."

Judy Shapiro
CEO, engageSimply
"They invest in the success of their clients which makes them flexible in accomodating the needs of growing companies."

Eric Liu
CEO, FairyGene
"I was impressed by their professionalism."

Bernice Ang
Founder, Thrive Life Consulting
"Excellent attention to detail and responsiveness."

DeVon Favors
Founder, Creating Favors LLC
"They have an excellent staff and great communication."

Marcello Rongione
CEO, WeOptimize Ltd