Loading page…

The client is a leading fuel technology provider based out of the US. They make fuel analytics available through their web app. Their app extracts data from GPS trackers and servers at the drilling sites and shows real-time insights. So, oil companies using this app get real-time fuel analytics directly from the web app interface.
Industry
Energy & Climate
Tech Stack
The client had this fuel monitoring software built already. But, the app needed granular-level insights and visual analytics. For example:
The lack of such analytics made it difficult for oil companies to understand what was going on with the fuel at the drilling sites. Oil companies couldn’t optimize processes efficiently or control costs. Our client, therefore, looked for ways to show more profound levels of fuel analytics. That’s when they contacted Capital Numbers.

Our client requested we add analytical graphs to the app. We had to create analytics to show real-time fuel levels, trailer information, supervisor names, CNG gas capture data, etc. We needed to display all such information through visually appealing reports and graphs.
Moreover, we had to configure several tenant-wide permission levels because this was a multi-tenant app. We also had to enable the creation of new logs in the super admin dashboard. Many such critical enhancements were needed to power up the overall workings of the app.
Capital Numbers performed a gap analysis initially. We then assembled a team of highly-skilled .NET Core and Angular developers for the job.
Our experts began by modifying the existing .NET Core app with new code. We changed several permission-level controls to delegate data confidentiality to each tenant. We made provisions for self-service password resets for each tenant. We also made provisions for the super admin to add/edit/delete log items. All this made the app a superior grade.
We then added new code to bolster the Angular frontend part. Here, we used Chart.js to represent fuel and gas dispensation data graphically. We also improved the UI flow to reveal the crew information, supervisor names, trailer name, and many such metrics. We ensured all charts and reports displayed data in easy-to-understand formats.

Next, we integrated Zapier to make PDF reports downloadable. Earlier, the app didn’t have Zapier integration. Users couldn’t download reports even if they wanted to. So, we added Zapier to help users view and download PDF reports in seconds.
We also integrated SignalR to ‘push’ real-time notifications on users’ devices about oil flow rates, dispensation status, etc. SignalR is one of the best notification engines for real-time apps.
We updated the code with TypeScript and used the MSSQL database to store all the data structures.
Once we made all the enhancements, we did a thorough QC for every solution we offered. We checked if the analytics detailed fuel flows, reports, and oil dispensation data. We tested if reports relayed real-time data. Once we ticked all the right boxes, we made the solutions live on the highly-scalable MS Azure server.






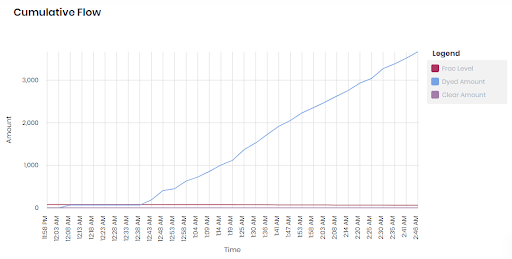
Capital Numbers’ work positioned the client for the future. We made real-time fuel analytics available through reports, graphs, and charts. Users in far-flung offices can now find granular-level information about an oil well from these graphs and charts. For example:
Our new dashboard shows cumulative oil flow data at five-minute intervals.
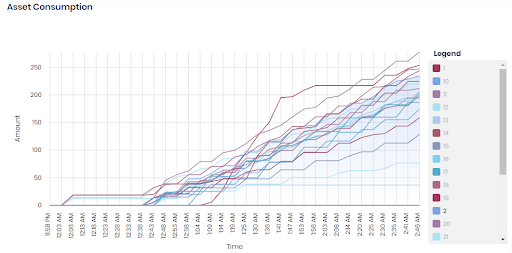
The dashboard highlights asset consumption data through eye-catching graphs.
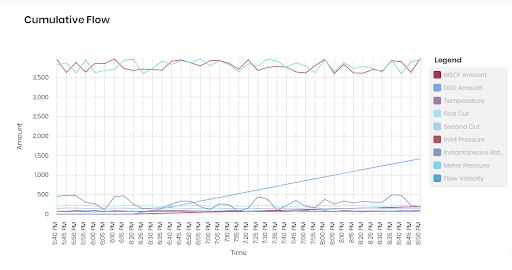
Graphical representations also show gas capture data, such as inlet pressure, flow velocity, meter pressure, etc., every five minutes.
Users can click the ‘Download PDF’ options for crucial fuel consumption information.
Fuel Consumption Information (12.05.2023)
Customer Name
ABC Energy Services
Oil Well Name
ABC Riverbank
Dyed Diesel Flow
15186.30
Clear Diesel Flow
98.5
CNG DGE Flow
0
Daily Stage Count - Diesel
8
Daily Stage Count - CNG
0
Trailer
XYZ
Supervisor
John
In-depth reports help understand clear and dyed fuel flows, supervisor names, trailer names, etc.
Detailed reports also help analyze trailer and supervisor performances at a site.
Intelligent analytics allow companies to assess the flow patterns at different oil wells.
Thorough assessments allow companies to track operations and prevent any fuel misuse.
Real-time alerts further notify users once an oil dispensation job is over.
A wealth of such crucial insights, presented through Capital Numbers’ analytical solutions, now make it much easier for oil companies to optimize processes and capacities and save up costs.

Industry: Energy & Climate

Industry: Energy & Climate
.jpg&w=2048&q=90)
Industry: Energy & Climate

Industry: Energy & Climate





Industry: Event Management

Industry: Healthcare