Loading page…
The client company builds and commissions converged network devices like routers, switches, servers, and sensors and offers device health monitoring solutions to ensure uptime. It caters to the energy, power, mining, and critical infrastructure sectors, offering intuitive device health monitoring solutions to manage converged networks proactively.
Industry
Energy & Climate
Tech Stack
Country
India
Installing converged network solutions is a transformative step for any organization looking to streamline its IT infrastructure. By offering real-time insights into the health of converged network devices, these solutions help IT teams identify device health issues from a centralized platform.
With more network devices becoming affordable and easy to install, companies of every size are standardizing their use of network devices within their IT premises. However, companies of every size don’t usually have a well-engineered device health monitoring system in place.
The client identified this gap and wanted to democratize technology by building a web application to help organizations across sectors accurately measure network device health metrics. The client wanted this app to evaluate the performance metrics of sensors, switches, controllers, detectors, servers, and cameras and display live data feeds.

They approached Capital Numbers to build this centralized software application. They requested our team to develop a large and complex app that could provide real-time insights into the status of critical network devices and assets.
Plus, they wanted this app to contain configurable micro apps, which organizations could tailor according to their needs. Each micro application had to have data visualization capabilities showing device health metrics, alerting authorities to any anomalies before they escalated into costly downtime.
Capital Numbers began by developing this application’s three micro frontends: a main micro frontend, an asset micro frontend, and a general micro frontend. We created each of these micro frontends as a self-contained React app, each one communicating with the other through powerful APIs.
We added configurable data visualization elements in each micro frontend, eliminating the risks of costly upgrades associated with monolith front ends. We also incorporated color-coded indicators to clearly show device health statuses. We concurrently added new features in each micro frontend without affecting the entire system, enabling easy development.
We built the backend using Python because it allowed seamless integration with various network devices and protocols. Python’s robust libraries, like Pandas and NumPy, came with various statistical functions that helped access and process raw data related to network device performance.
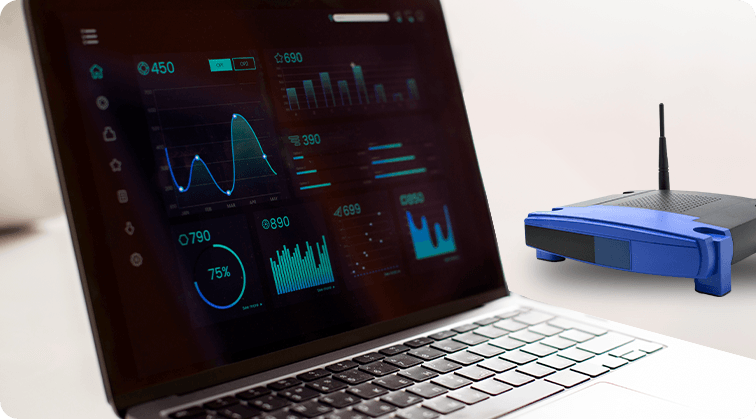
For data storage, we used PostgreSQL and enhanced the app’s overall code quality with TypeScript. We incorporated alerts and notifications within the system using the NATS messaging layer. With NATS, we could enable prompt detection of potential network device failures. With Grafana's beautiful charts and geo maps, we could create customizable dashboards.
In addition to the above, we added NetraGPT to allow users to query and obtain device health reports and metrics. By training the GPT model, we fully equipped it to respond to complex user queries about network device health.
Once we made all the integrations, we checked the optimal performance of the dashboards and summary views. We thoroughly diagnosed if the system gave visual reports of network device health metrics and interfaces precisely as needed.


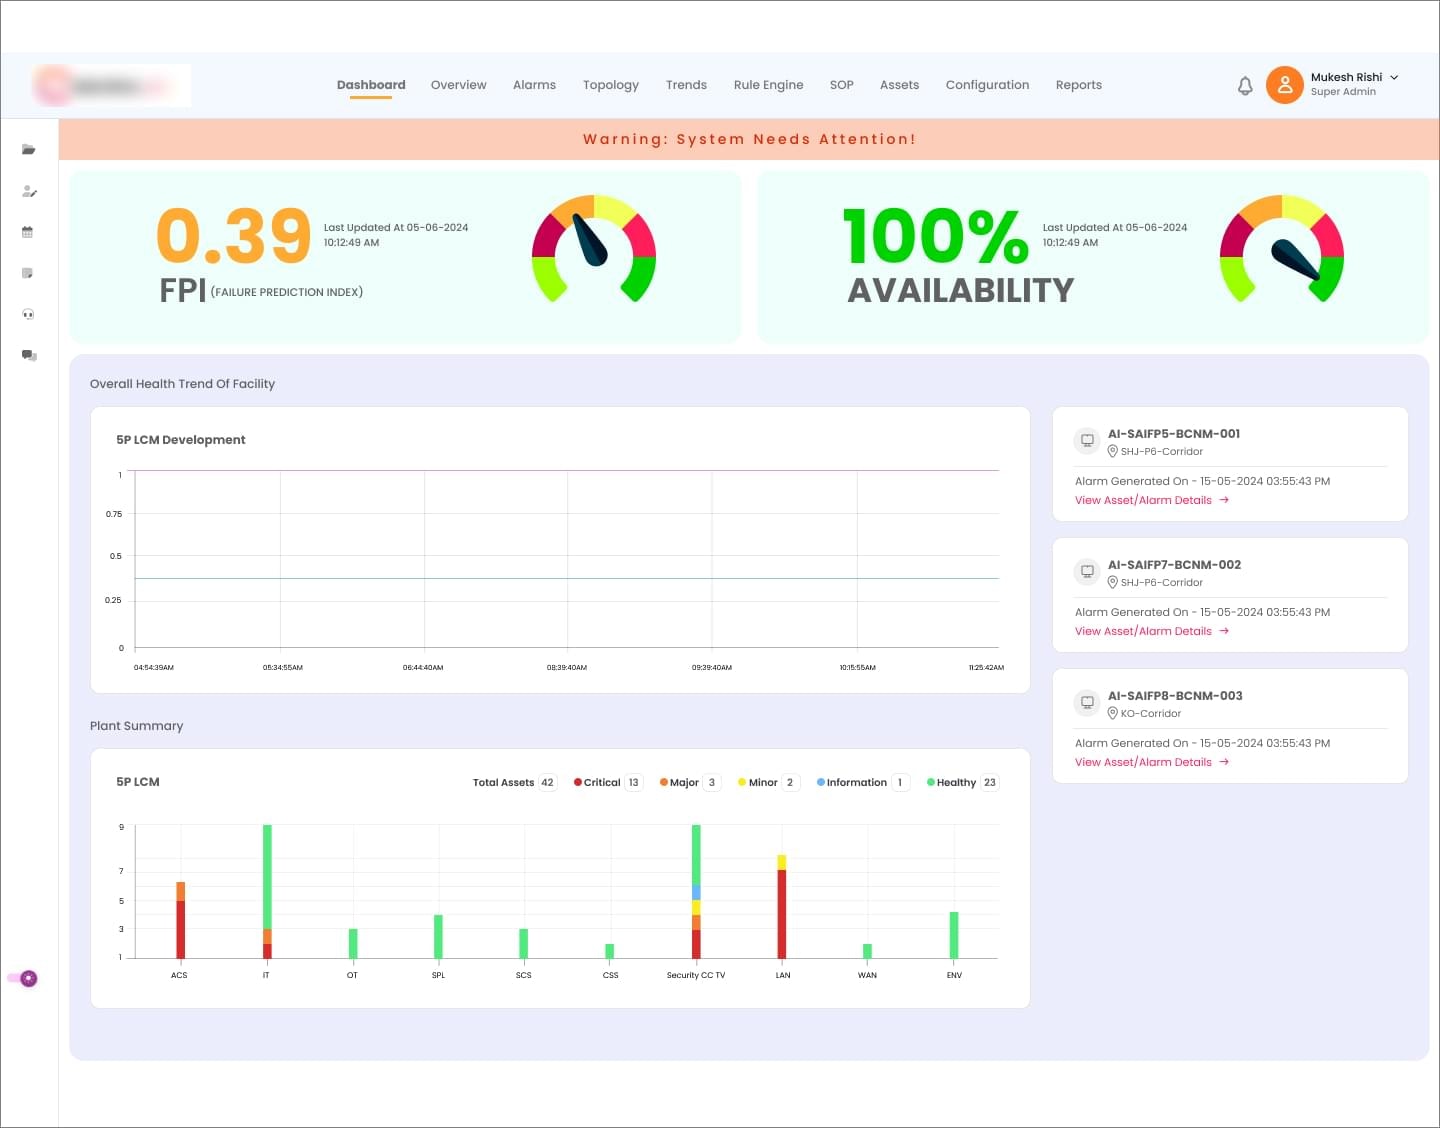
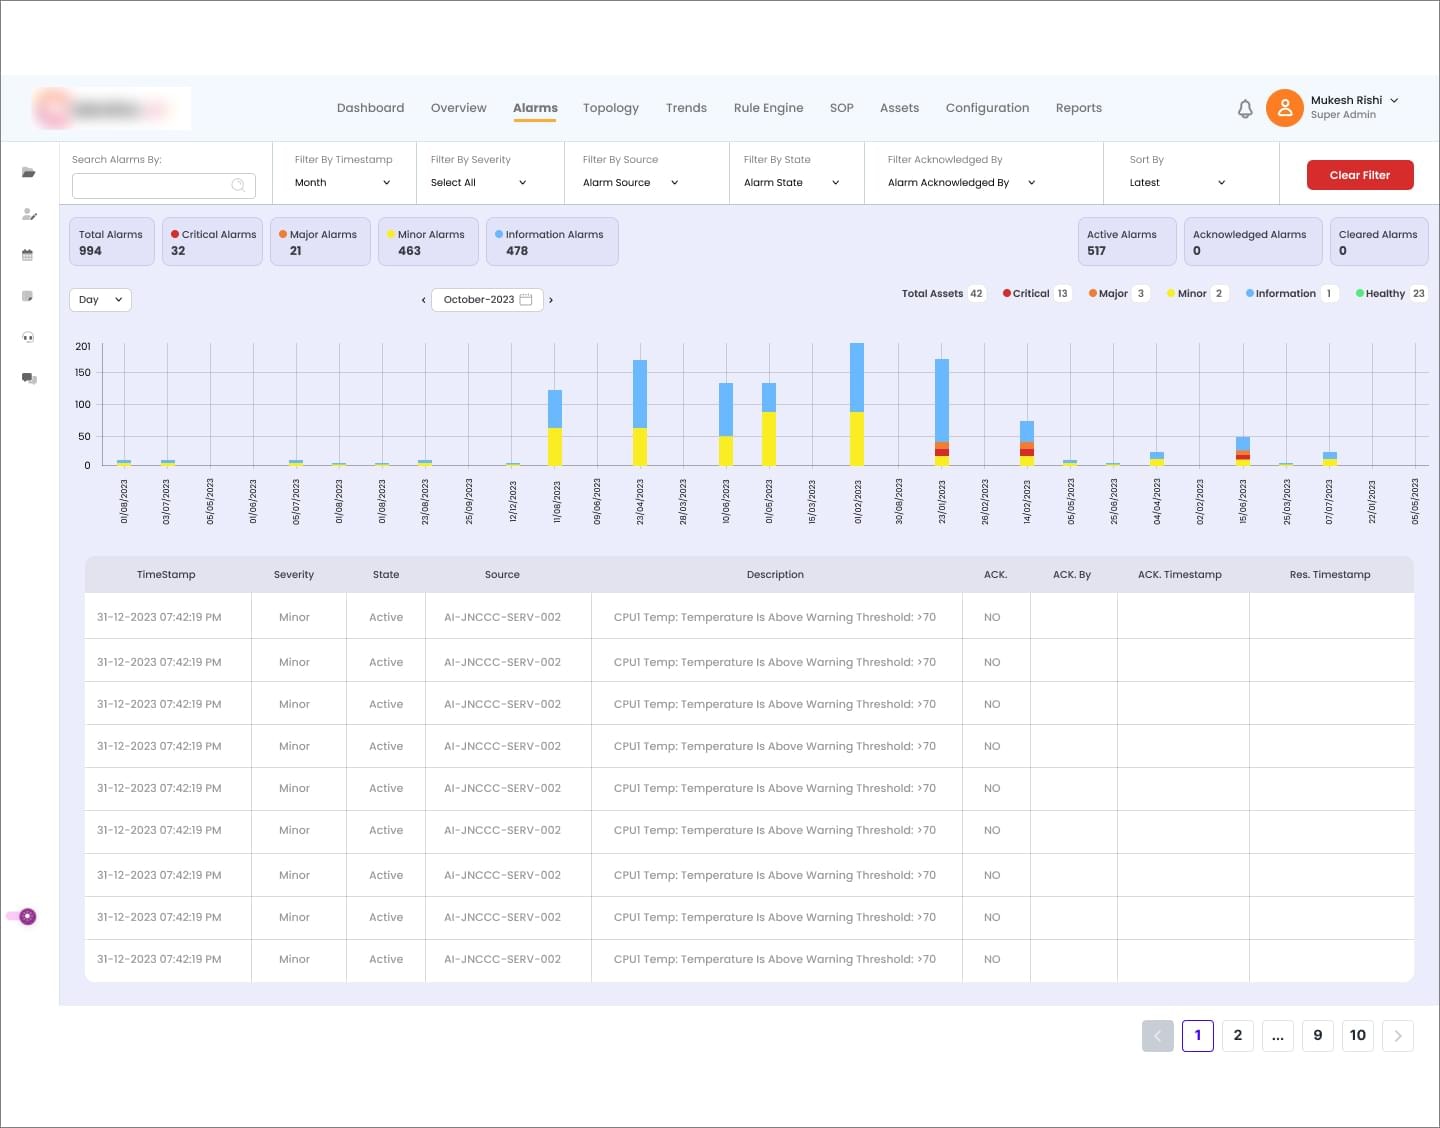
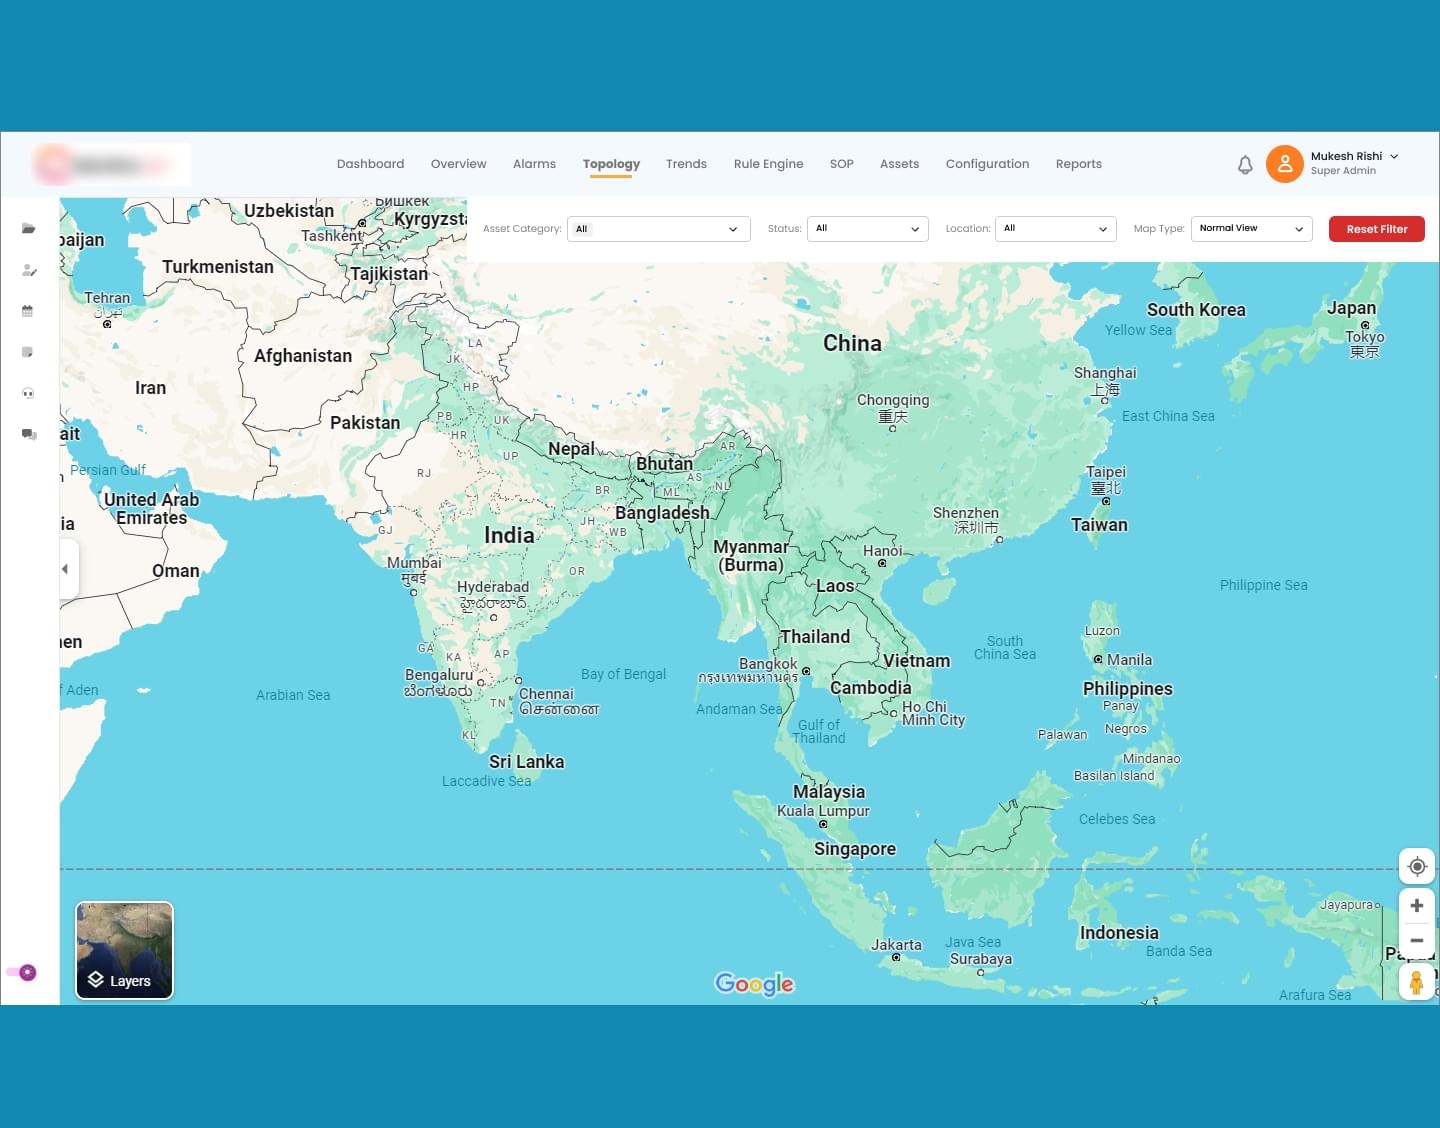
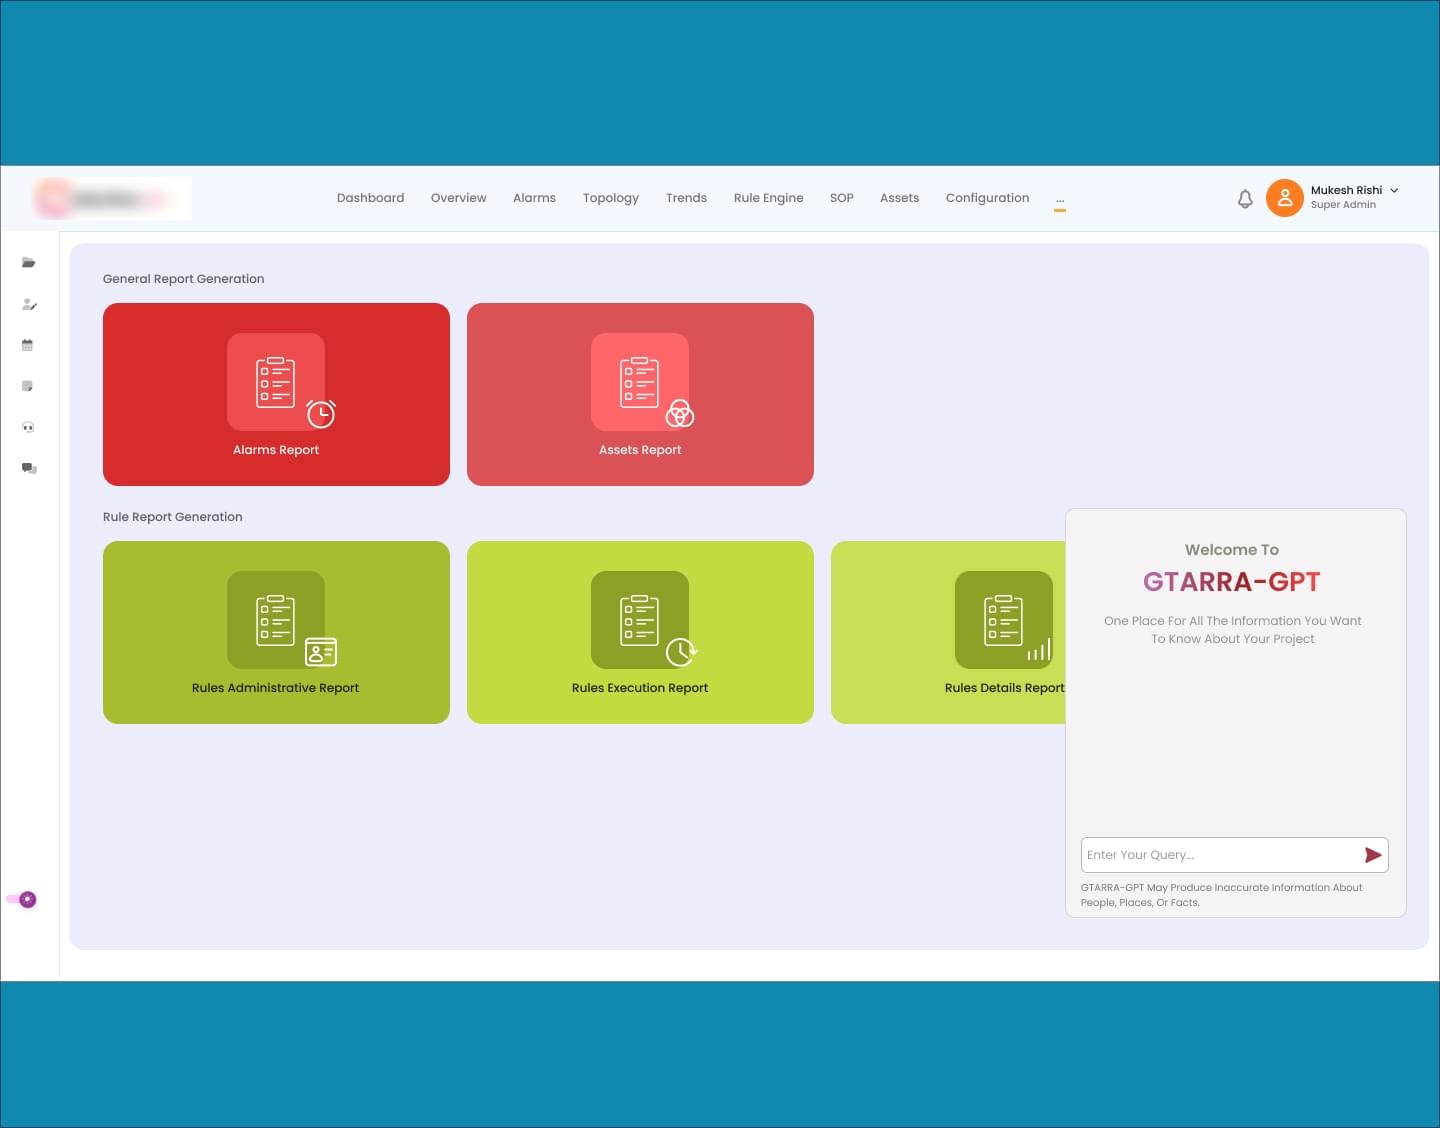
Capital Numbers’ strategic architectural decisions drove exceptional outcomes. The final product is an outstanding GUI containing transformative insights and intuitive displays on device health metrics. Here’s what the application brings forth:
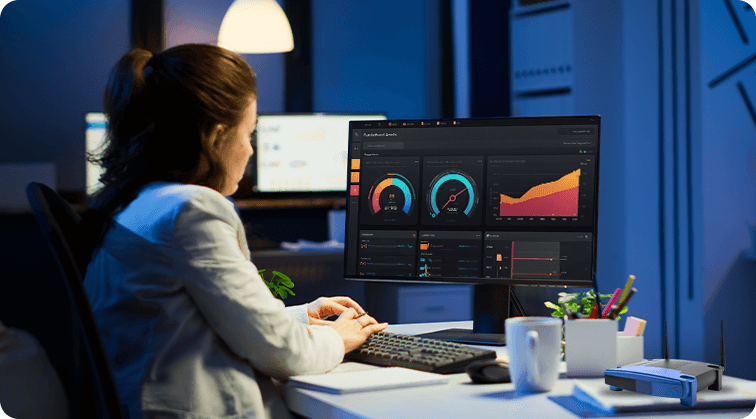
Live data feeds show real-time performance insights: CPU usage, interface usage, power usage, system load, device uptime, failure rates, device temperature, and more.
Dynamic graphs update automatically to show the current status of network devices.
Color-coded indicators show device health: green for healthy, yellow for warning, and red for critical.
User-defined layouts allow users to personalize dashboards to see metrics that matter most.
Timestamp graphs help analyze historical data over hours, days, weeks, and months.
Trend lines enable comparisons of device performance metrics over time to identify patterns.
Threshold alerts warn when thresholds (like CPU use or system load) cross the normal range.
Notifications inform users promptly about any potential bottlenecks that need attention.
Drill-down functionality allows viewing specific metrics to get detailed logs about a device.
Smart filtering enables data sorting to isolate specific devices, periods, or metrics.
Network topology with geo-maps shows the connections between devices within an IT premise.
Interactive elements like GPT allow users to query and obtain specific device health reports.
Crystal clear reports allow visual intelligence and proactive network management.
Industry: Energy & Climate
.jpg&w=2048&q=90)
Industry: Energy & Climate
.jpg&w=2048&q=90)
Industry: Energy & Climate

Industry: Energy & Climate




Industry: Event Management
Industry: Healthcare