Loading page…

The client offers a game-changing dashboard hooked to utility meters, turning raw data into crystal-clear insights. The dashboard is like having an X-ray vision for a network of buildings’ electricity, gas, and water usage, helping decision-makers spot energy waste, improve efficiency, and nail sustainable building management with style.
Industry
Energy & Climate
Tech Stack
Country
Australia
Managing energy data was turning into a massive headache for the client. With energy meters logging data every 15 minutes across multiple buildings, the client faced 96 readings per meter daily from diverse sources like FTPs, emails, APIs, and scattered files. It was a messy jungle of numbers full of gaps, errors, and mismatched formats.
But that was just the start. Making sense of all this data was like scooping water from a sinking boat - it wasn’t enough. It posed a real challenge. The raw data was noisy and incomplete, making it nearly impossible to spot energy-saving opportunities.
Even when the energy data was ready, speed was critical. With over 100,000 rows of energy data pouring in daily, building operators couldn’t wait around. They needed a visual, simple, and actionable dashboard that turned raw numbers into stories.
Moreover, the goal wasn’t limited to monitoring energy use. Building operators wanted to predict future trends and optimize costs. But creating accurate predictive models wasn’t a walk in the park.

Buried under all this chaos, the client reached out to Capital Numbers. The mission: to build a visual tool that could cut through the noise, decode energy data, and provide crystal-clear insights with trend predictions that hit the bullseye.
The project wasn’t just about data engineering and management. It was about turning confusion into clarity, giving building operators the tools to cut energy waste and create more sustainable spaces.
Capital Numbers approached the project by piecing together tailored solutions to every challenge. First, we replaced chaotic manual logs with a sleek, automated test scheduling mechanism that made patient slotting a breeze. Next, we delivered a real-time tracking feature that showed test statuses at a glance: in progress, completed, or overdue. We then added a result-flagging system that spotted and escalated abnormalities to prevent patient risks.
Additionally, we built interactive charts to show real-time analytics of patient history and pending tests. To put healthcare teams in the driver’s seat, we built customizable filters - letting them slice and dice patient data by date, test type, or urgency.
However, the most complex part was developing dynamic patient intake forms. We handled the UI/UX to create these forms using radio buttons, drop-downs, and text boxes. But, the work wasn’t just about throwing some digital forms; it required meticulous attention to data validation and input processing. So, behind the scenes, we built a sophisticated backend engine.
The engine ensured each input field’s visibility was linked to specific conditions. For example, if a patient selected "Diabetes" under medical history, the form would instantly adapt to display additional fields like "Type of Diabetes" (Type 1 or Type 2) and "Current Medication" (with a drop-down for Insulin or Oral Medications).
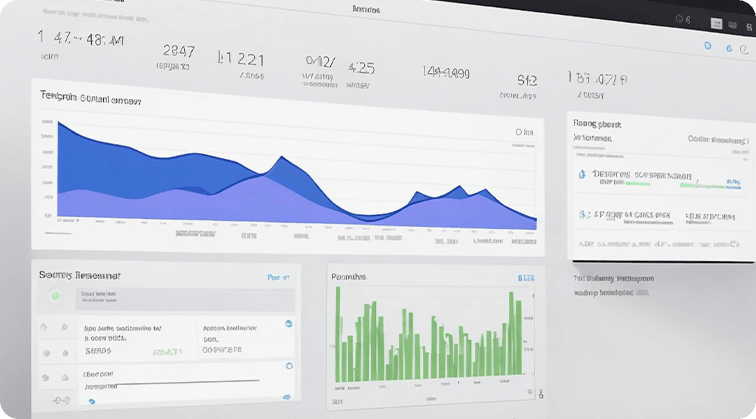
We didn’t just show the present - we predicted the future. Using Python, Pandas, and Scikit-learn, we built machine learning models to churn out 5-day energy consumption forecasts. These models did the heavy lifting, surfacing hidden inefficiencies and opportunities that would’ve otherwise gone unnoticed.
We didn’t stop there. With automated submeter analytics, we pinpointed inefficiencies in everything from water heaters to lighting, elevators, pumps, and even kitchen appliances. By shining a light on these energy-draining areas, we helped cut costs down to the smallest detail.
And then came the game-changer: real-time tracking. By integrating the EventZero API and a notification system, we made energy consumption and carbon emissions trackable every 15 minutes. Operators didn’t just get insights - they got alerts for unusual patterns, giving them the power to act on issues the second they surfaced.
This solution, hosted using AWS, was all about cracking the code of data engineering and visualization. By blending cutting-edge tech with solid solutions, we turned mind-boggling complexity into crystal-clear insights to help buildings run greener and smoother.


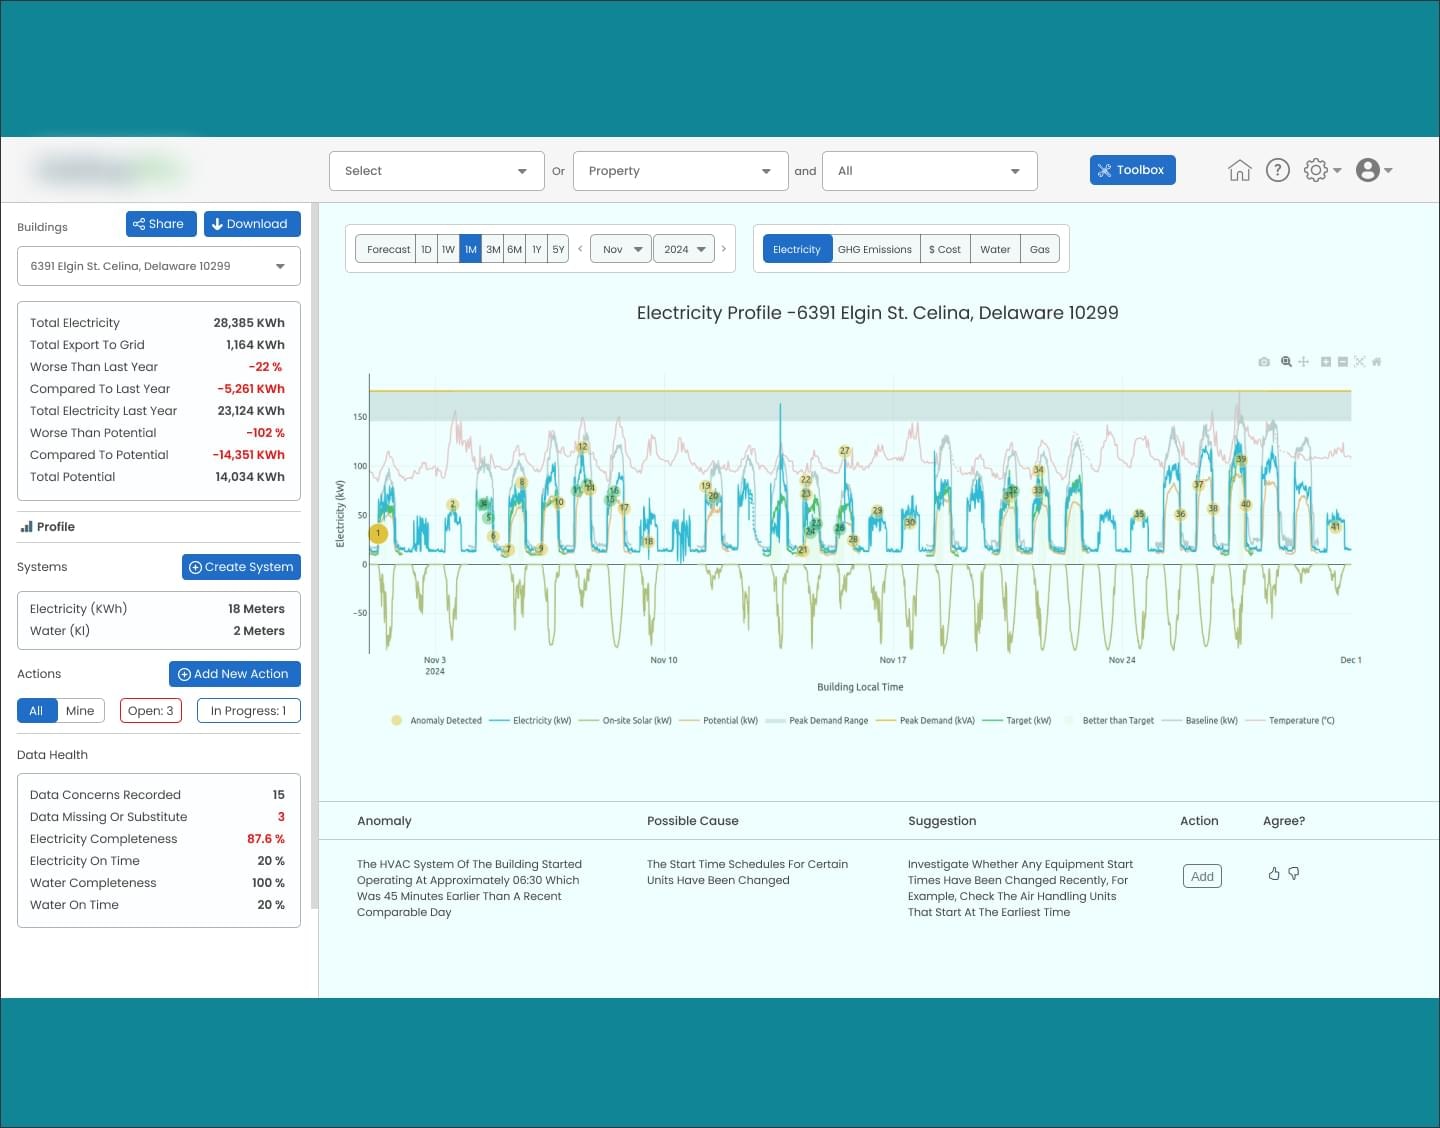
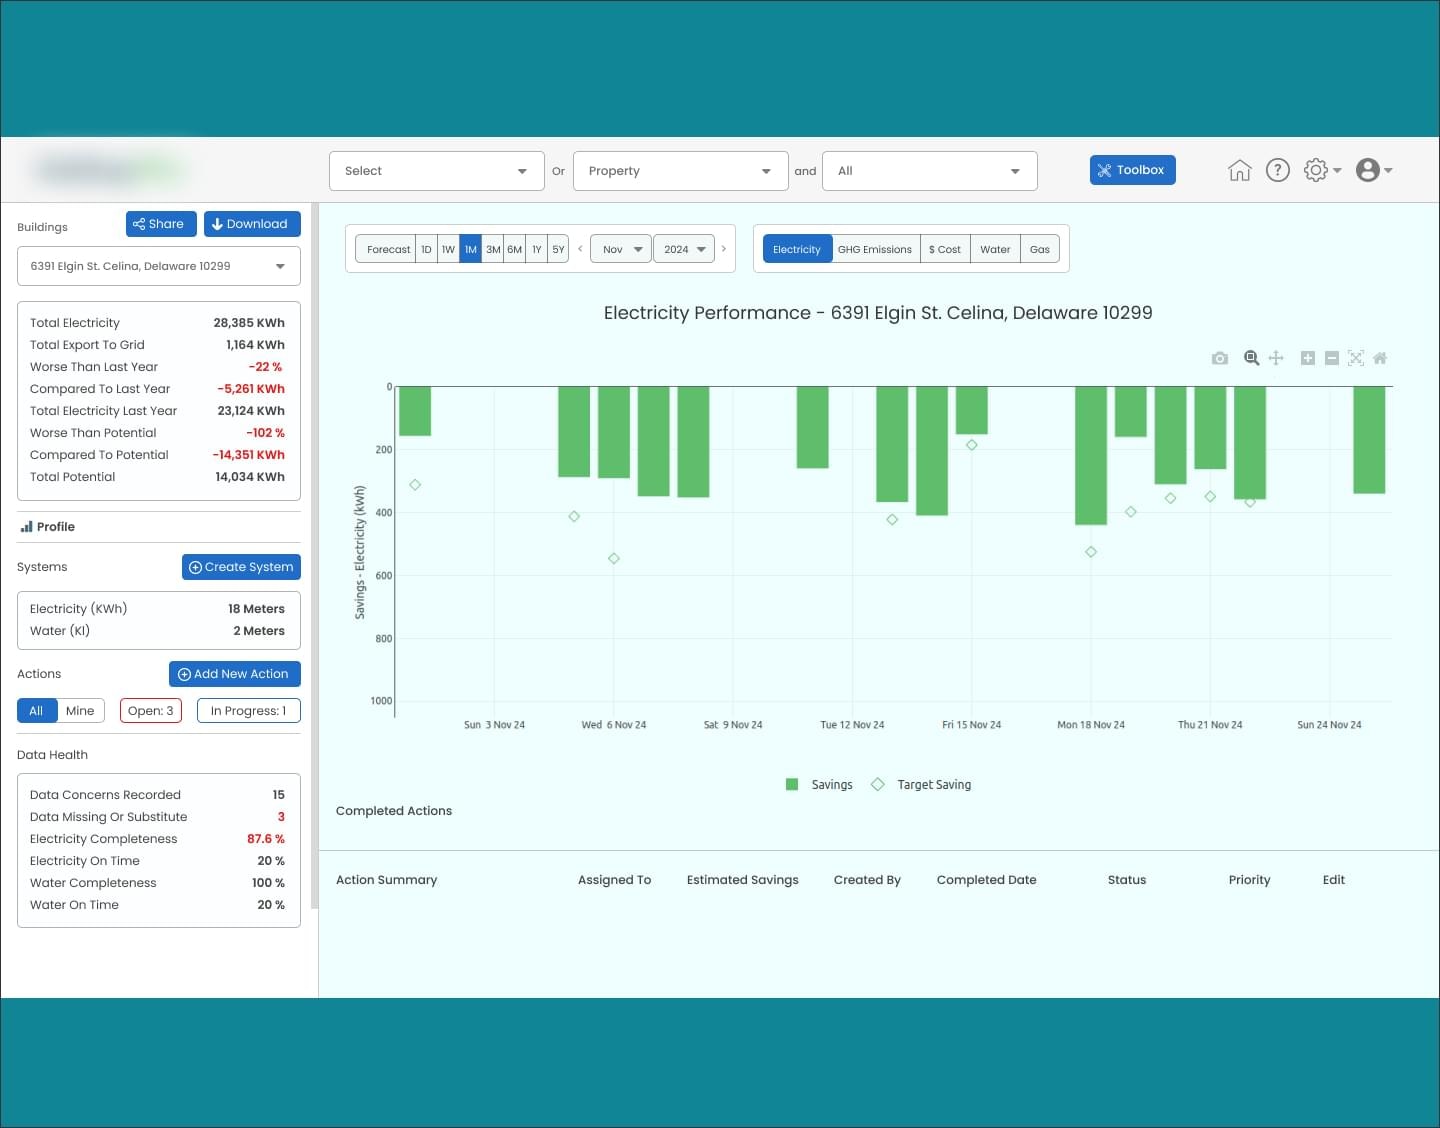
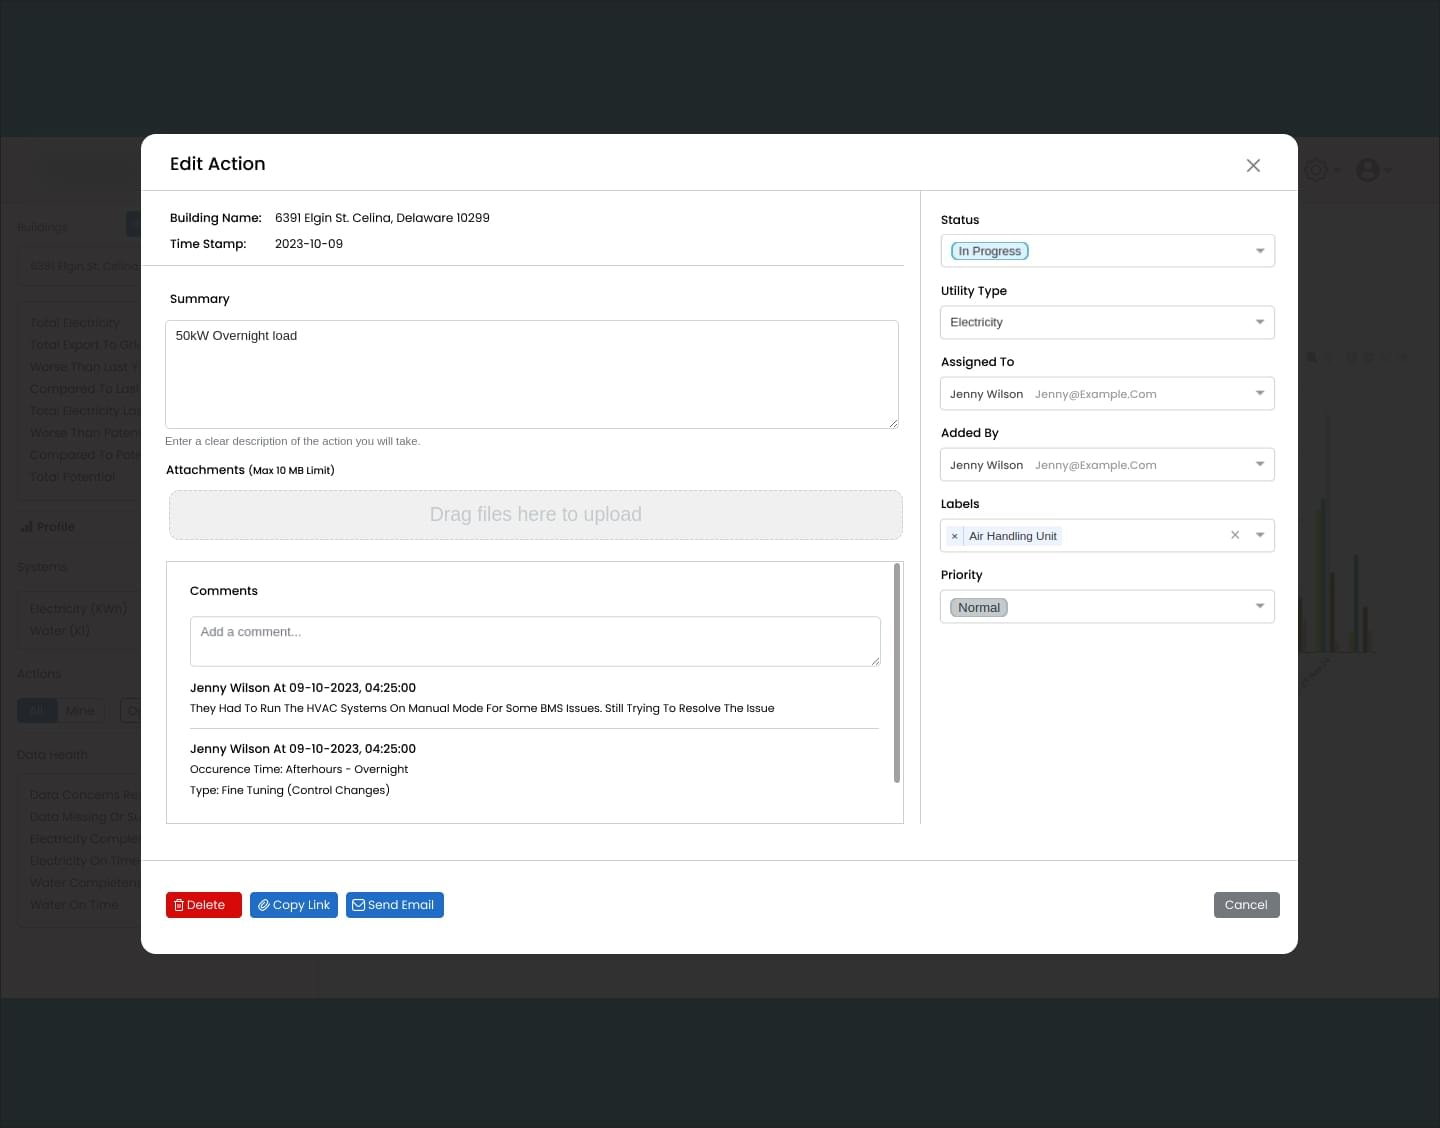
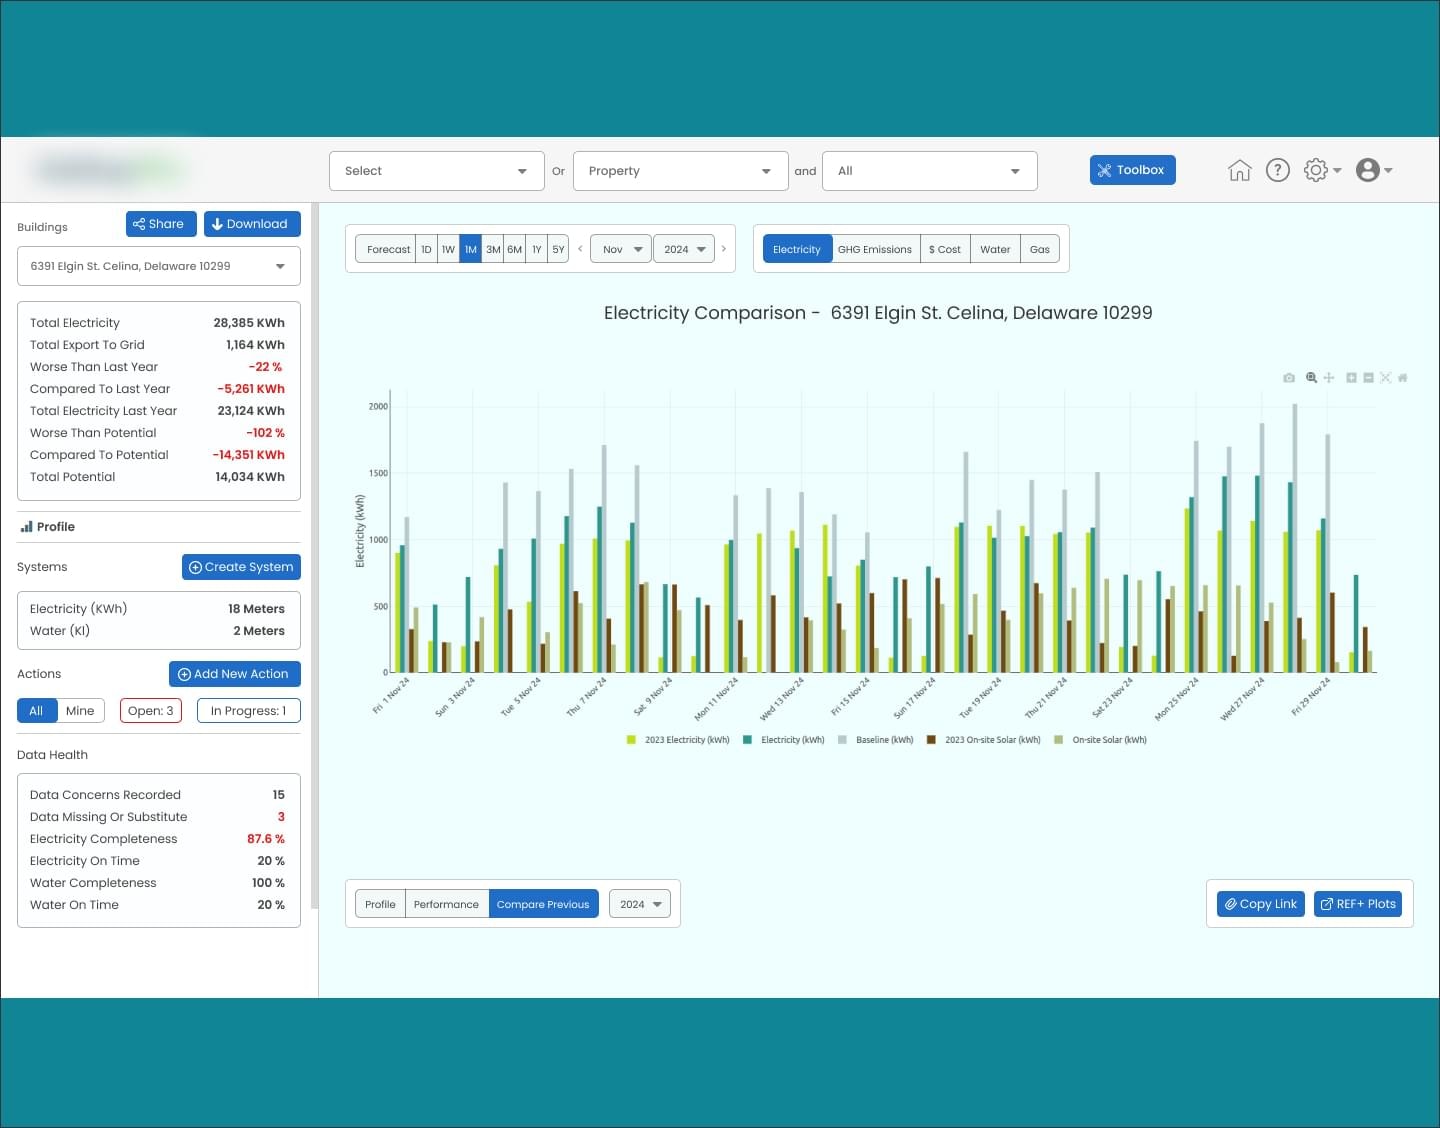
Capital Numbers excelled at pulling out all the stops to create a powerhouse dashboard - fusing diverse data streams and packing it with advanced analytics. The result? Real-time insights, spot-on forecasts, and game-changing energy efficiency for building operators.
Here’s what the outcomes are:
ETL pipelines transform raw energy usage data into accurate insights for seamless analysis.
The dashboard can process massive data sets in real-time, even under intense demand.
Energy usage data spans multiple sources, including electricity, water, gas, and heaters.
Electricity usage tracking across multiple buildings saves thousands of dollars every year.
Building-specific water consumption insights save up to 10,000L per month.
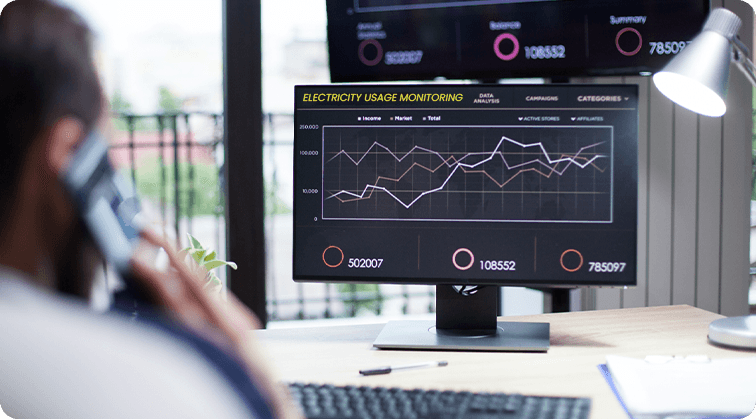
Gas consumption data across heating systems help lower costs by up to 15%.
Precise tracking of carbon emissions accelerates compliance with green building standards.
Predictive models forecasting 5-day insights allow for more intelligent energy optimization.
Submeter readings empower stakeholders with precise utility cost insights.
Alerts based on submeter anomalies prevent equipment failures and downtimes.
By processing innumerable readings, the dashboard turns infinite insights into decisions.
Industry: Energy & Climate
.jpg&w=2048&q=90)
Industry: Energy & Climate

Industry: Energy & Climate

Industry: Energy & Climate




Industry: Event Management

Industry: Healthcare