Loading page…

The client owns a firm specializing in recruiting, information technology, and consulting services for law firms. They manage a team of experienced lawyers and technology consultants who rely heavily on data analytics to make informed decisions and evaluate case data.
Industry
Legal Services
Tech Stack
Country
USA
The firm used to maintain legal case data using Excel spreadsheets previously. The categories of data included litigation cases, arbitration cases, case laws, pleadings, case outcomes, judgments, court fees, etc.
Such diverse data came from CSV files, SQL databases, Google Ads, CRMs, and other repositories. The firm used to generate reports based on this data and provide comprehensive data analysis to providers of legal services.
Soon, however, it became no less than a battle for the client to deal with large amounts of data in static Excel sheets. From version control nightmares and performance lags to data visualization limitations, Excel sheets turned their daily tasks into a time-consuming ordeal. Moreover, a lack of real-time collaboration options in Excel left the client in complete trouble.

Additionally, there were human errors in manual data entry and reporting. Plus, large datasets slowed down work in Excel sheets. Unauthorized access to sensitive information loomed always. Losing hours of work due to corrupt Excel files was another difficulty the client had to handle.
Excel file management became a major productivity killer. Discovering a smarter way to handle data was crucial. At this stage, the client contacted Capital Numbers and requested our team to suggest ways to solve their problem.
We suggested migrating their data management system from Excel to Power BI. This transition was necessary because Power BI’s data visualization capabilities far surpass Excel.
But, before moving chunks of data from Excel to Power BI, we studied the Excel sheets. We soon realized that multiple users on the same sheet risked overwriting each other’s changes, leading to massive chaos.
Therefore, we began systematically importing all crucial data from Excel into Power BI. Once we imported it, we cleaned the data to ensure it was in a suitable format for analysis. Next, we built data models within Power BI to integrate additional data from SQL databases, Google Ads, CRMs, CSVs, and other formats.
We performed the above data extraction, cleaning, and modeling tasks using Azure Data Factory (ADF) and Databricks, which are high-performance data pipeline management tools. ADF is a robust orchestrator for managing data pipelines from various sources. Databricks platform, too, is a powerful solution for performing complex data computations at scale. By leveraging these tools, we ensured that data was not only extracted but also transformed into insights in Power BI.

Next, our team used Power BI's visualization solutions to create interactive charts, graphs, and storyboards. At this stage, we transformed two-dimensional Excel tabs into visual reports in Power BI.
Using Power BI's collaboration features, we offered role-based access to every user, ensuring data security and collaborative decisions. It helped us eliminate multiple version control issues users face in Excel.
With Power BI's intuitive date filtration, we sliced and diced data by specific dates and times. This fostered a more insightful data analysis, eliminating tedious manual back-and-forths experienced while applying filters in Excel.
Using Power BI's automated refreshes, we managed data updates in real-time, reducing the risks of errors associated with manual VBA refreshes in Excel. Most importantly, we reduced a 4GB Power BI file into a sleek 16MB using data compression techniques, ensuring quicker load times for faster analysis and decisions.




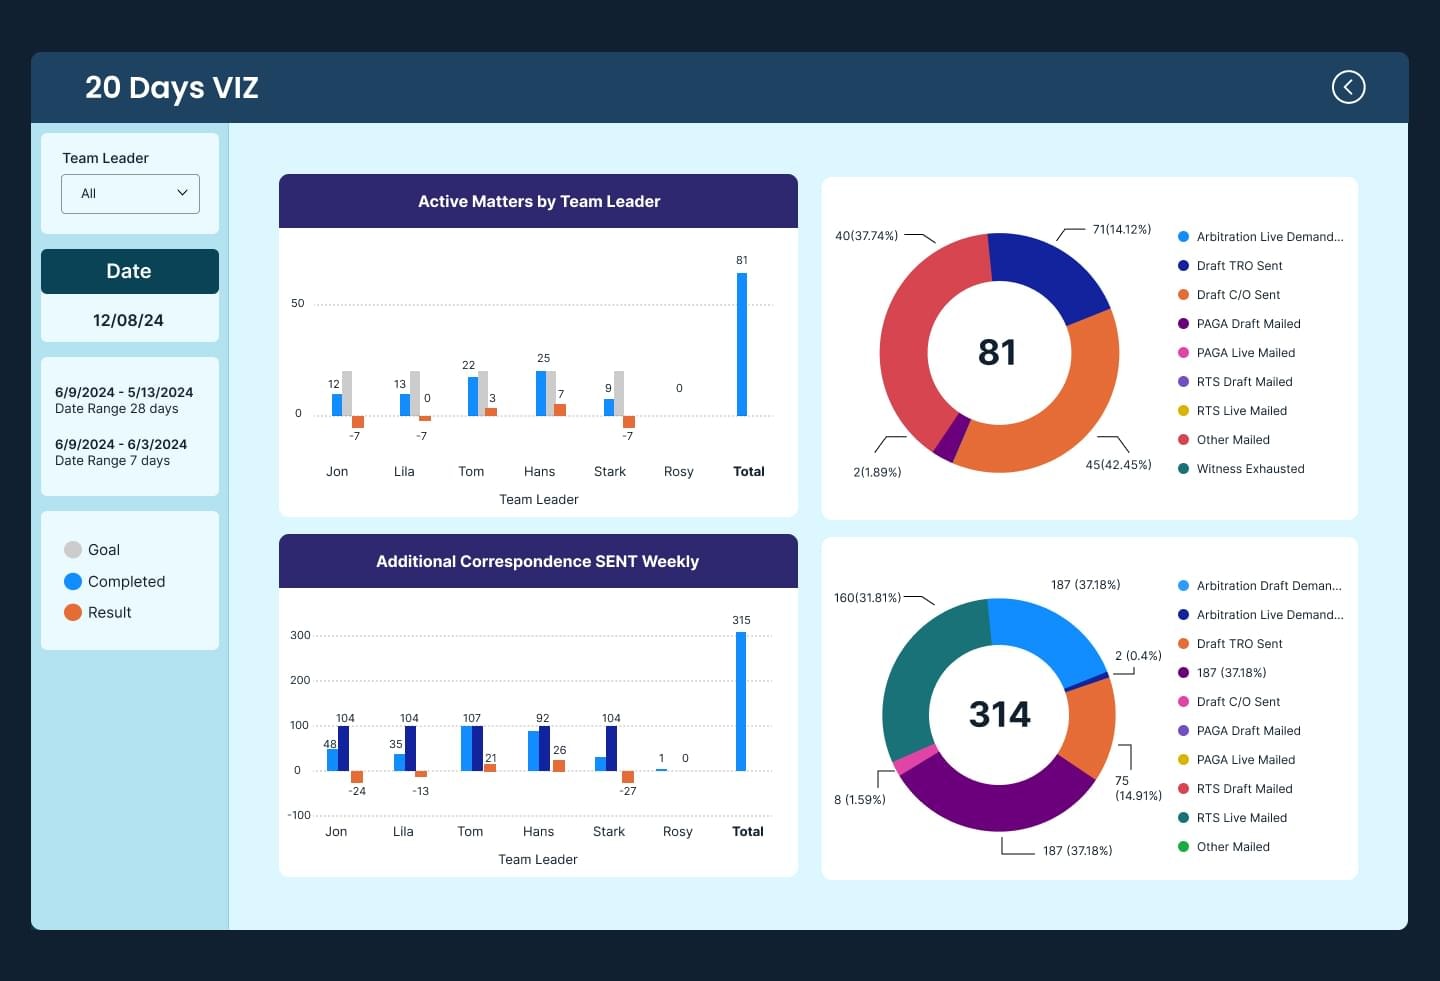
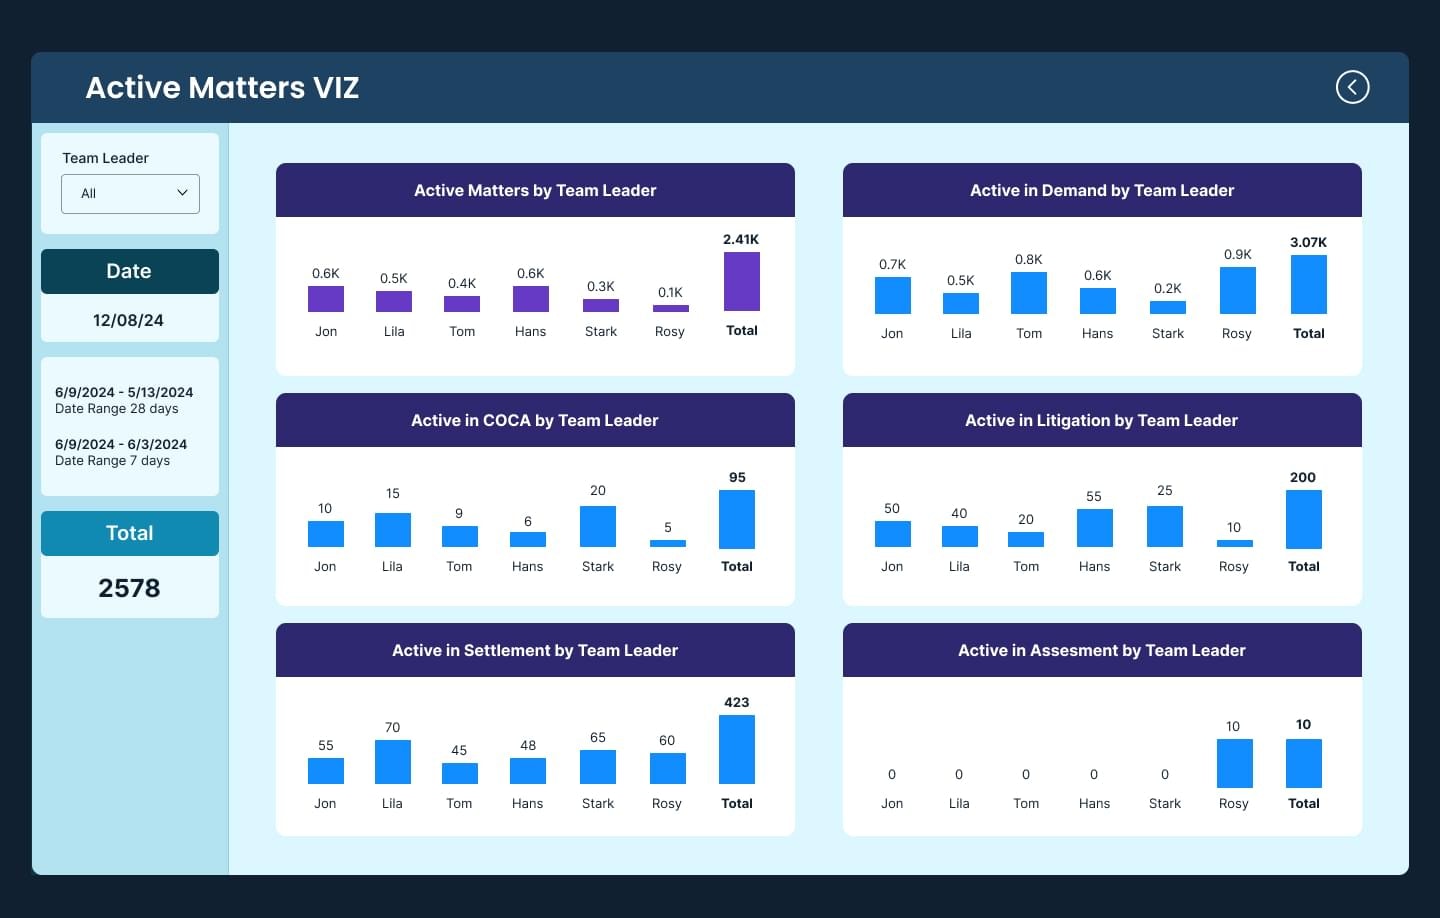
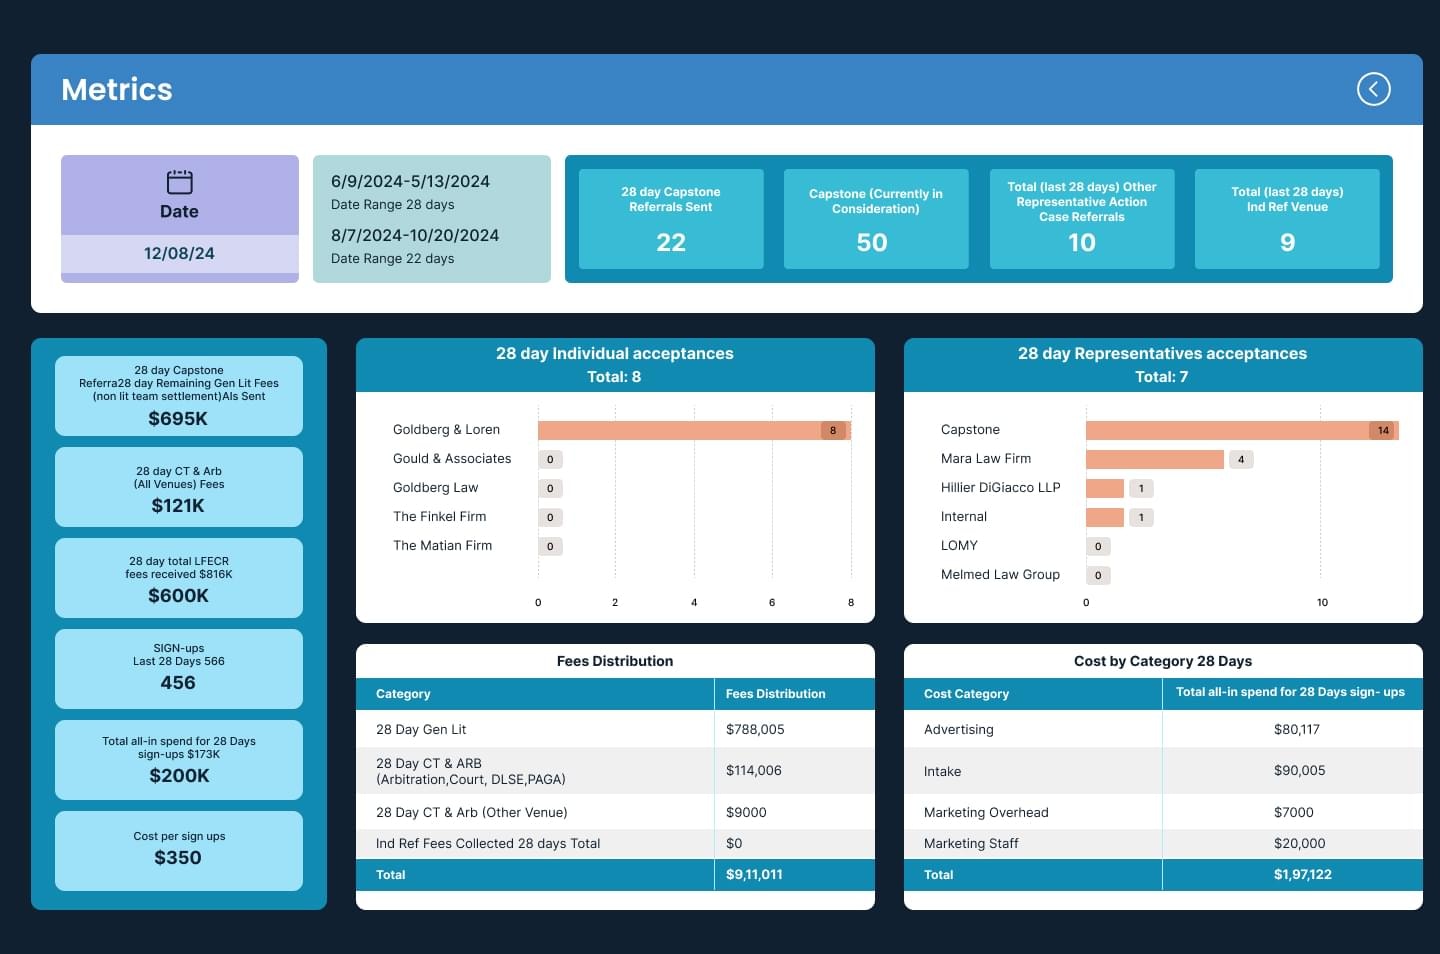
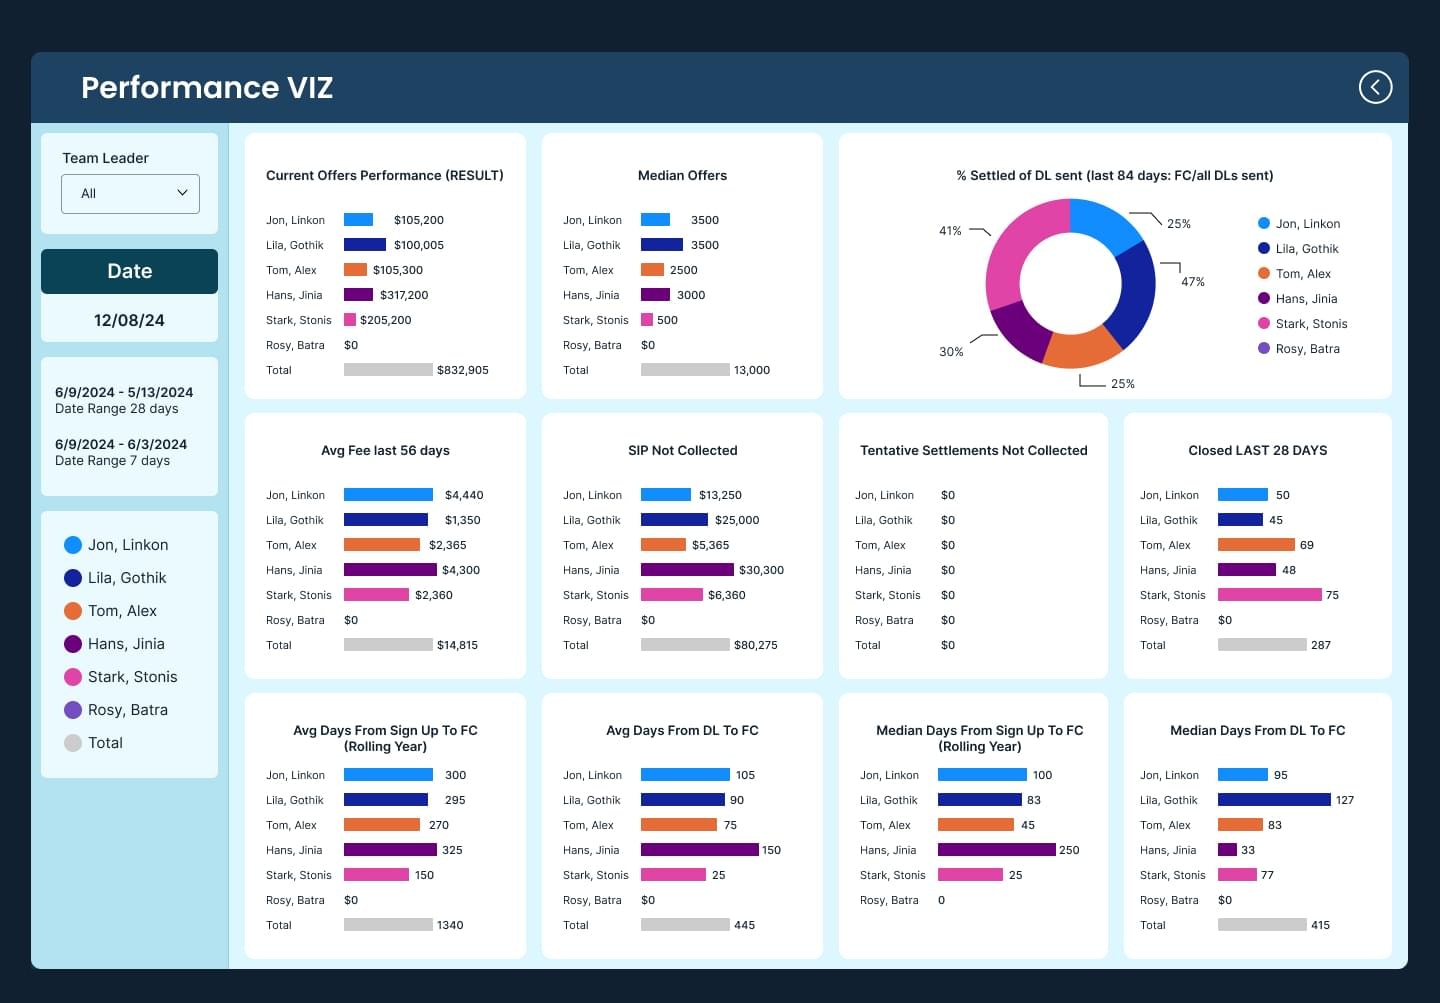
Extremely happy with Capital Numbers’ step-by-step data migration work, the client deeply trusted us with future optimization tasks, empowering us to take on greater challenges head-on. Here’s how our well-executed Power BI solution benefited the client:
Power BI provided dynamic and interactive visualizations, unlike the static tables in Excel.
Automated Power BI refreshes ensured updated reports as against manual updates in Excel.
Power BI helped manage large volumes of data far beyond Excel’s capacity constraints.
Power BI’s advanced analytics offered deeper insights, which Excel sheets limited.
Custom visualizations in Power BI enhanced data storytelling, surpassing Excel’s chart options.

Shareable Power BI reports improved team collaboration and removed version control fiascos.
Robust security features in Power BI ensured data protection beyond Excel’s basic security.
Data processing and loading in Power BI became more cost-effective than in Excel.
Power BI’s sophisticated filtration capabilities provided more nuanced data analysis than Excel.
Unlimited data storage in cloud-based Power BI removed local storage limitations in Excel.
Unmanageable Excel files turned into Power BI visual sophistication ensured superior analysis.

Industry: Legal Services

Industry: Legal Services


Industry: Legal Services

Industry: Legal Services

Industry: Legal Services