Loading page…

Nowadays, manually tracking sports results is a tedious job. Instead, if there are app dashboards that show sports activities or outcomes, things become much more manageable. Such app dashboards typically sync with wearable techs. So, they collect activity results from those techs and reflect them to end users. In-built GPS further helps capture athletes' position and location. Our client owns similar iOS and Android apps that show sports data and outcomes.
Industry
Gaming and Sports
Tech Stack
The client specifically requested Capital Numbers to build these app dashboards. He came to us with this proposal because he found manually tracking school sports results overwhelming.
He needed an easier way out. Through tech, he wanted to capture students’ athletic data like kilometers cycled or meters ran. So, he approached Capital Numbers to create iOS and Android app dashboards that would do the job.
He went through our portfolio and was impressed by our iOS and Android app development work. So, he entrusted us with this project.
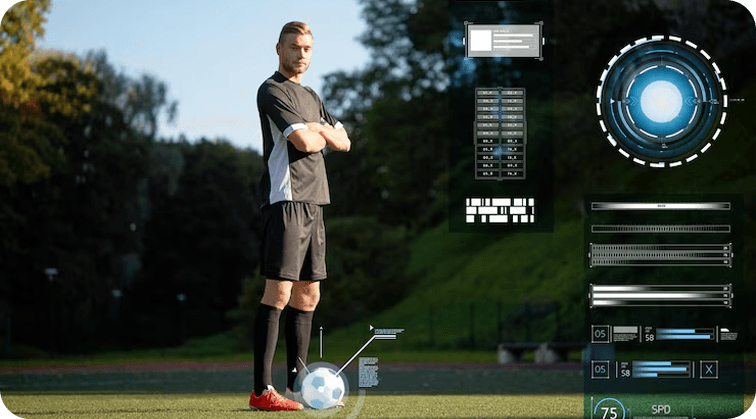
Our key challenge was to create iOS and Android app dashboards that could help the client with the following:
In short, we had to offer solutions that help with sports data visualizations. Moreover, we also needed to remember that we shouldn’t reflect every data point. We had to extract only the relevant ones (requested by the client) and show them with proper labels, etc.
We aligned our highly-skilled iOS and Android developers for the job. Our experts analyzed the client’s needs and came up with the following solutions:
iOS App Development - Our expert iOS developer used SwiftUI to develop the iOS app dashboard. SwiftUI helps build great-looking interfaces. It is integrated into Xcode, allowing developers to achieve tasks faster.
Android App Development - Our Android developer used Kotlin to build the Android app dashboard. Kotlin helps with code safety. It also has no runtime overheads. So, it was a perfect choice for hassle-free development.
Next, we used the Apple Healthkit (in iOS) and Google Fit (in Android) to fetch data from their raw sources.

Apple Healthkit extracts activity data from Apple’s wearable devices and stores them in its local database. So, we linked this kit with our iOS app using custom codes to present activity data on the dashboard.
Similarly, Google Fit fetches activity data from Android’s wearable devices and stores them in its local database. So, we linked this kit with our Android app using custom codes to show activity data on the dashboard.
We also added the GPS tracking function to track students’ location data in both apps. We used it to show routes covered by students during running or cycling.
In the end, we tested both apps in our local dev. Once everything worked well together, we deployed the iOS and Android apps on Apple App Store and Play Store.





Our project continued for around 2.5 months with successful solution deliveries using Agile practices. Smooth collaboration happened because we held regular meetings with the client over Slack. Here’s what ultimately resulted because of our work:
We created easy registrations where students can sign up on these apps using admin-generated usernames and passwords.
Once students sign up, they find a list of sports challenges (biking, walking, cycling, etc.) in which they can participate.
We created app dashboards that help the school admin see students’ activity data, such as the following:
We could extract the above data from third-party services like Apple Healthkit and Google Fit.
The above third parties sync with a variety of wrist-worn gadgets students use, such as:
Because the third parties sync, they collect data from these wearable devices they find nearby.
Because we wrote custom codes, the data collected from third parties get translated on dashboards as progress bars, charts, etc.
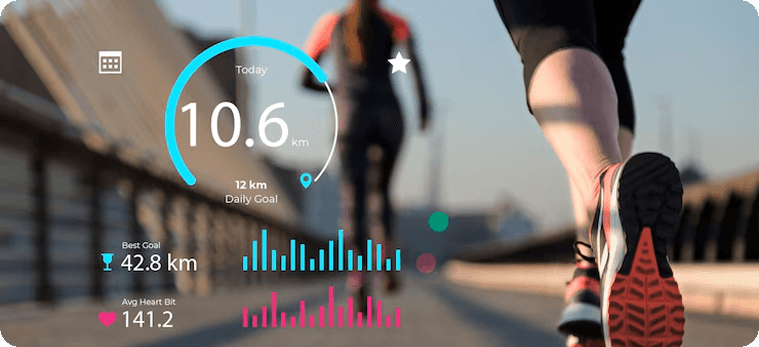
Our solutions currently help the client aggregate readings in real time.
Our client also gets activity metrics on the go.
Because we used GPS functions, the admin tracks activities in specific routes and trails.
We also made things fun-filled by adding gamification components, such as:
We made the apps scalable to help the client add more sports challenges if he wants in the future.
Because of our work, the client no longer depends on manual processes. He uses the app dashboards we created to view sports data and outcomes. Turning to Capital Numbers for dashboard development and data visualizations is a decision the client is extremely happy with.





Industry: Event Management
Industry: Healthcare

Industry: Gaming & Sports

Industry: Education

Industry: Gaming & Sports